It is a pain to manually create charts in Excel so I thought I'd look at some U.S. charts using the amazingly awesome charting tool, FRED, at the St Louis Fed.
First up, the good news. The underemployment rate (as measured by the "U-6") has come down markedly from its highs. There seems to be some debate among economists (at least the kind on TV and radio) as to whether or not unemployment rates will ever go back to 'normal' levels. In other words, is there a new NAIRU. But for now, the trend seems to be for lower rates of unemployment and underemployment. Supporting this idea, hours worked has recovered nicely from the lows. Clearly, more people working and firms requiring more labour hours is a good thing.

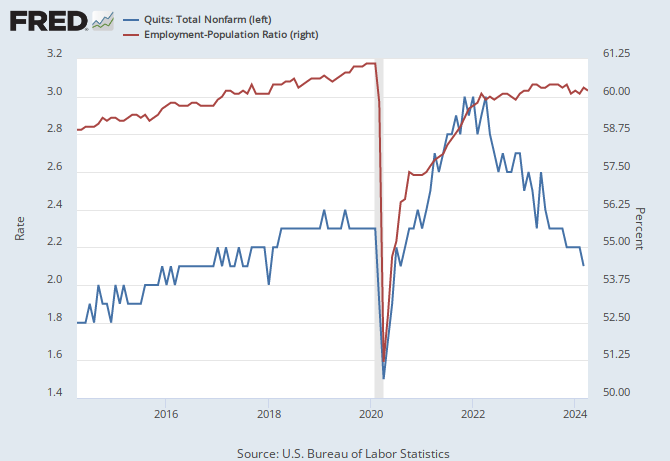
Now the less good news. While the quits rate has also improved from the lows, it's still below a 'normal' 2%-ish rate (although we'll have to wait and see if it continues to trend higher or flattens out here). This may be hinting at continued friction or lack of choices for workers trying to move jobs, and improve their lot in life. The big bad news is the size of the working population. Post-Great Recession, a great percentage of the population seem to have stopped working--or at least stopped being counted.
No comments:
Post a Comment